Guest post by Masha Rutenberg on COVID-19
This is part of a series of guest posts from students in my Biostats class at UH Mānoa. For their final projects, students analyzed data to understand what factors explain variation in COVID-19 incidence. Read more about the project here.
I chose to sepcifically take a look at the over-all total population of individual countries and compare their confirmed cases, because I was truly curious to see to what extent does population have a role on the spread of the virus. I predict, that as the total population increases so will the total Covid-19 confrimed cases. I undertood that my findings would be similar to that of my predictions. Additionally, as I was compiling data from about which country was affected, I noticed that some countries also had no quarantine regulations. This idea does not pertain to my study but it hightened my curiosity a bit more.
I decided to gather my data from the Johns Hopkins University Coronavirus Resource Center that not only proved to be a great resource for raw data, but it also featured great interactive maps. With the help of these maps, I was able to visualize the location of each effected country and its proximity to other effected nations. With that in mind, I came across the ultimate question that would then become part of my sole statistacal research. I have decided to analyze if there is a relationship between the total population of people of a country affected by COVID-19 and the amount of Covid-19 cases reported.
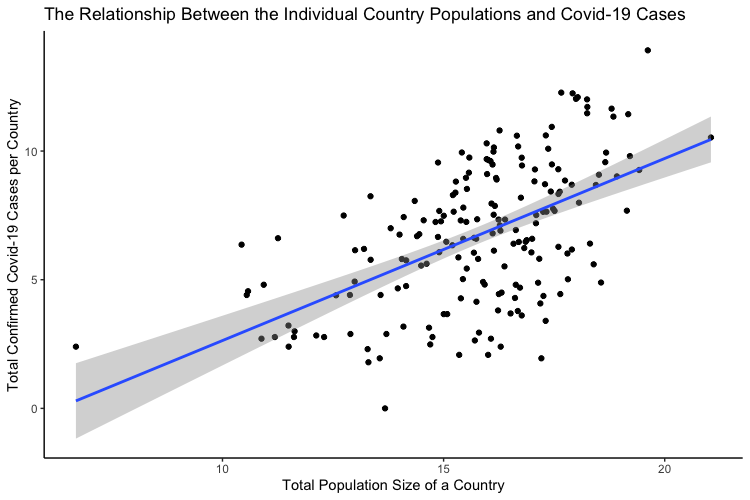
Each part of the data was dispalyed via scatter plot with a line of best fit. A Pearson’s correlation analysis was also completed. Due to the fact that the raw data provided an extremely unlegable scatter-plot, the data had to be transformed using a log transformation in order to make it more accesible.
For the first part, the entire collection of countries and their Covid-19 stats, the results were as expected. After the graph was formulated, a Pearson’s correlation analysis was conducted. A calculated $P$-value of $5.5 \times 10^{-16}$ rejects the overall null hypothesis which states that there is no relationship between the population of a country and the amount of confirmed cases. The 95% confidence interval is from 0.44 to 0.64. The correlation coefficient is $r = 0.55$ which shows a positive relationship.
Based on these analyses, I conclude that overall the population of a country does indeed influence the total confrimed Covid-19 cases. A limitation of this entire project is the fact that data is constantly being added. The data that I have provided is limited to just the beginning of May. Currently, Covid-19 cases are still growing so the numbers can adjust. I also took data from one particular source, it is unclear how often the source updates their numbers for each country or if even every country has reported their data.It is quite possible that there is a vast amount of confirmed COVID-19 cases that have yet to be reported. Additionally, this data does not include any data about restrictions that were applied to many nations. Some of these nations have applied a mandated quarantine while others have not. This could be thought of as the confounding variabe. While the population of some countries may be large, if they have a mandated quarantine it will in theory lower case numbers, yet if there is no quarantine cases numbers will increase regardless of the population number.